The Heart of the Atlas: Species Accounts
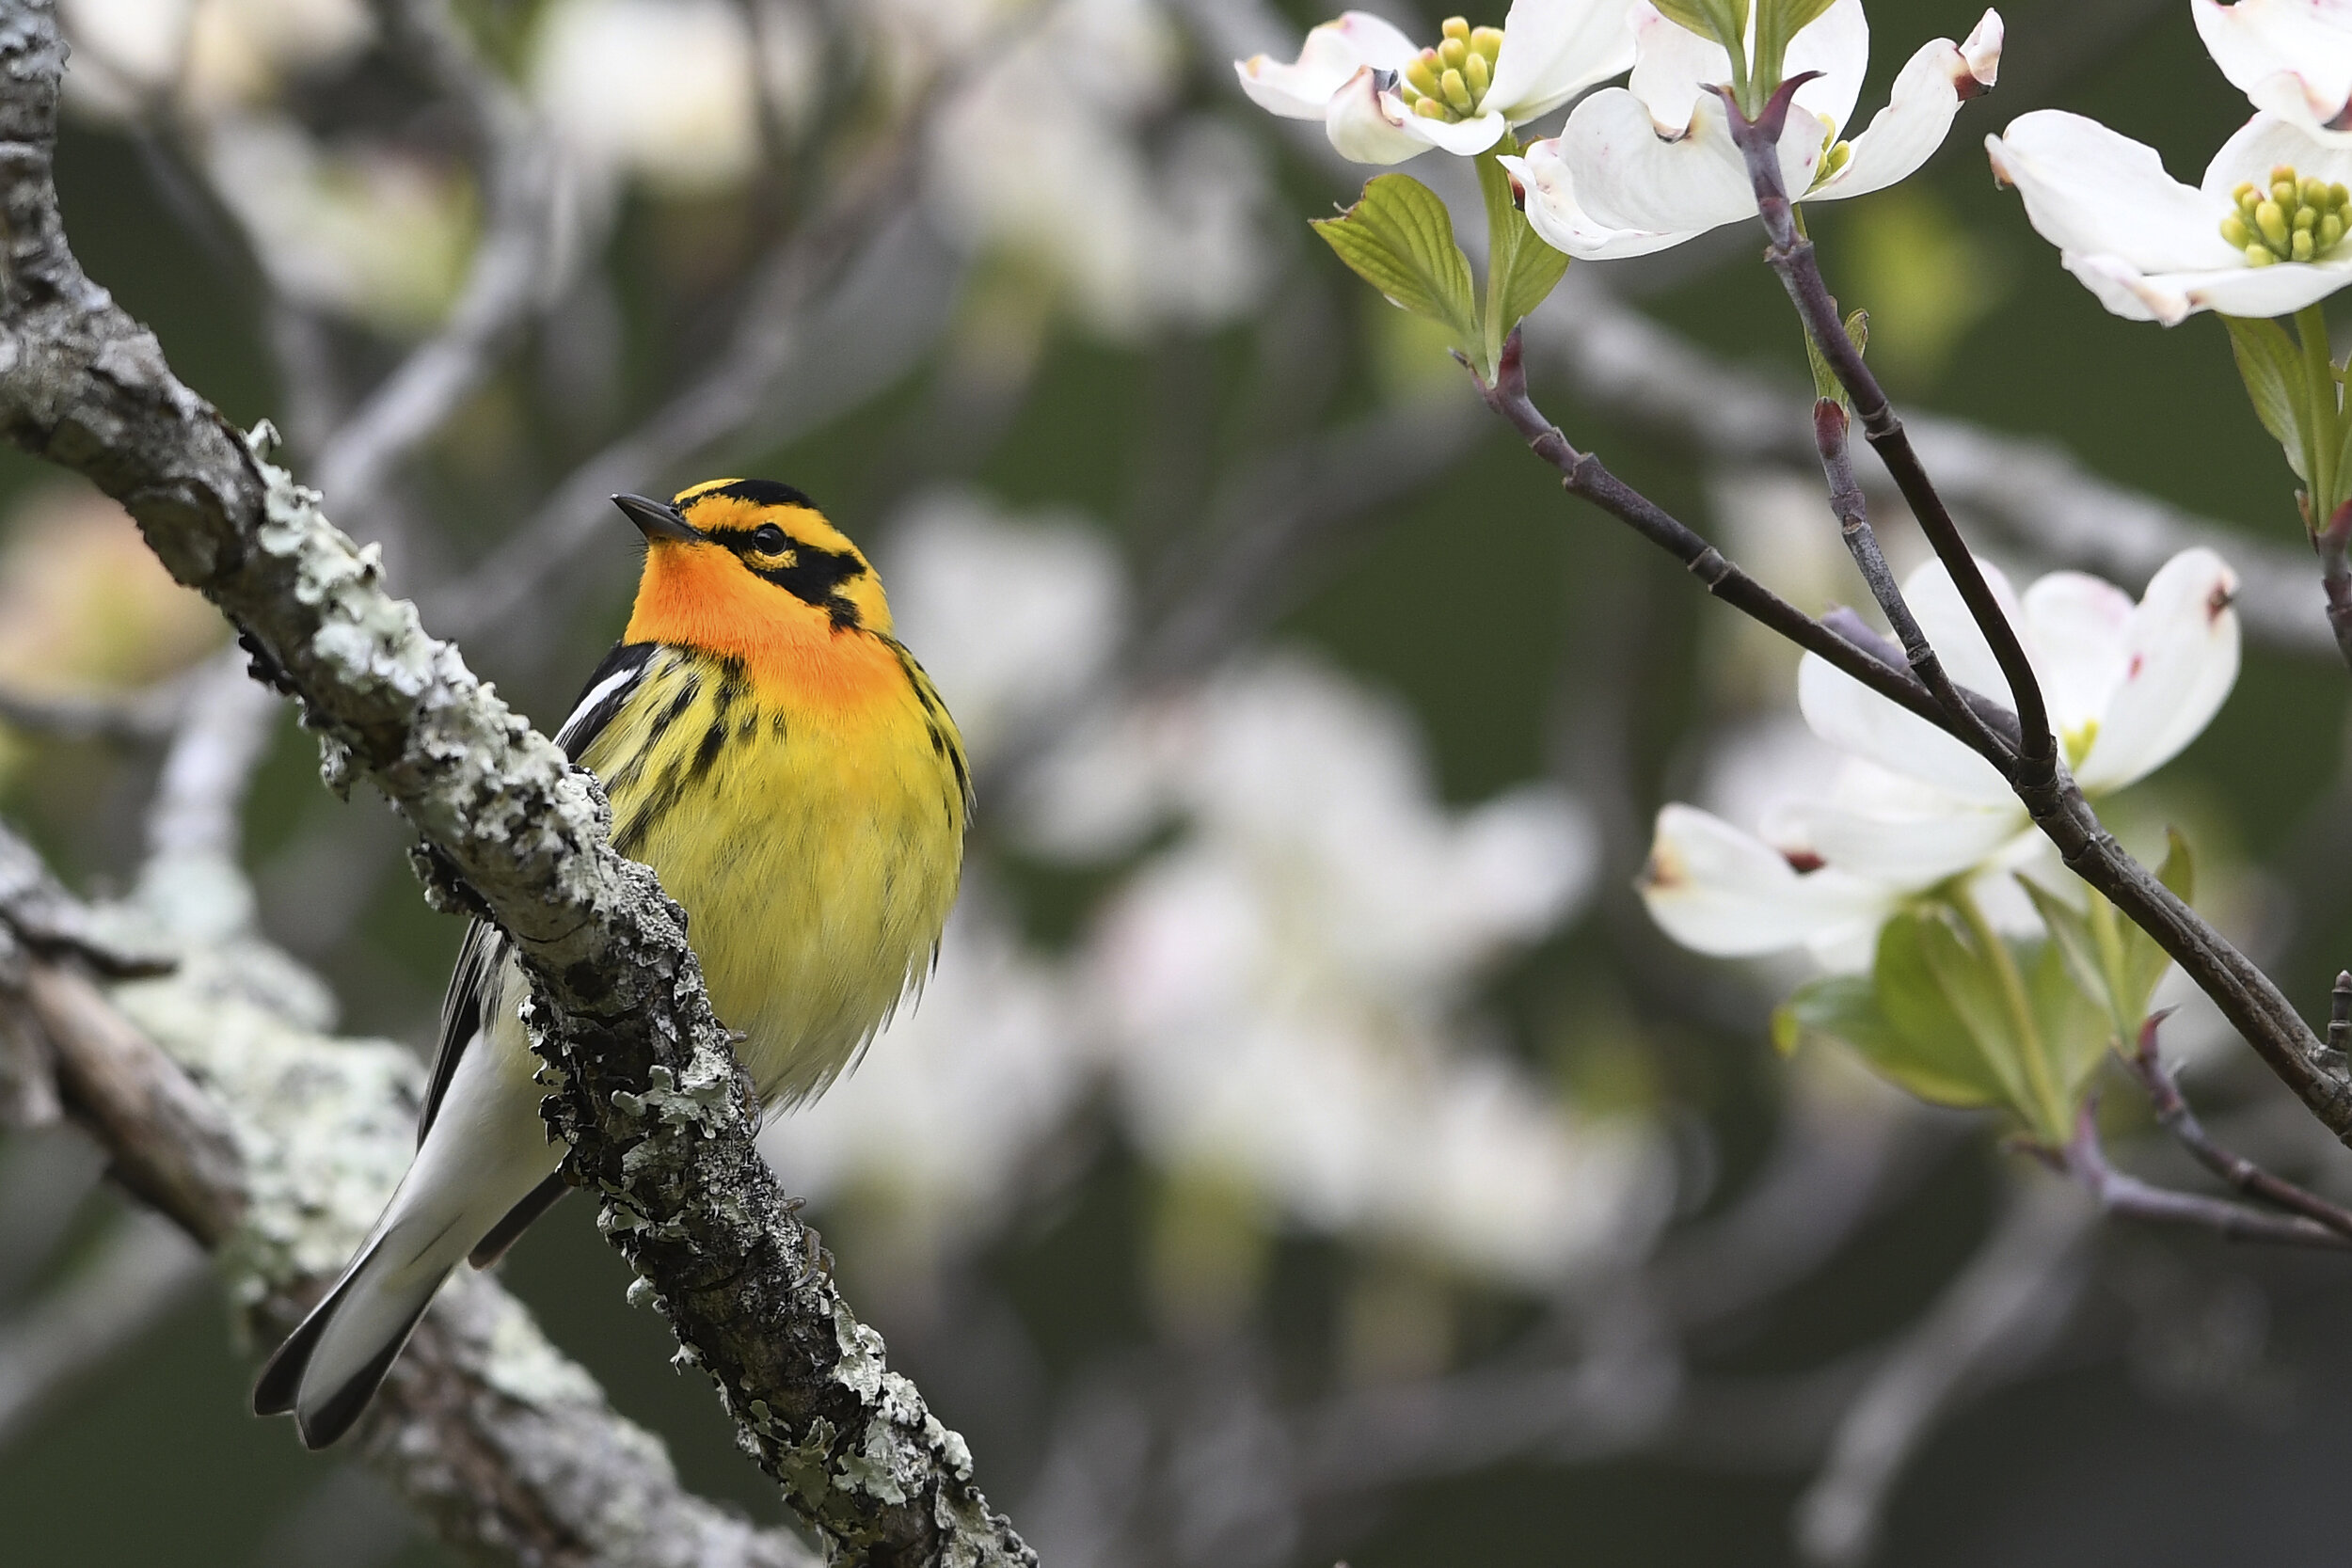
Photo: Blackburnian Warbler, Dick Rowe
When the 2nd Virginia Breeding Bird Atlas website is published on its website, you will undoubtedly notice that most of the content is devoted to the species accounts for the state’s more than 200 breeding species. So, what is a “species account”?
The North American Ornithological Atlas Committee Handbook gives us a concise answer:
“… breeding evidence and other maps and species accounts are the mainstays of the atlas publication. The maps and species accounts summarize concisely each species’ breeding distribution and abundance, as well as information on changes over time, in the case of repeat atlases.” 1
The Atlas Final Products Committee has outlined the species accounts to include:
Graphic items - maps, tables, charts and photos
Narrative providing expert and clear interpretation of Atlas results, using a writing style accessible to the general reader as well as to researchers, scientists, conservation professionals and others.
Maps
Maps are perhaps the most important part of any species account. The Atlas will present maps that show:
Geographic distribution of the breeding observations for each species across Virginia documented in the 1st and 2nd Atlases,
Occupancy maps based on estimates of the geographic distribution between the 1st and 2nd Atlases, i.e., between 1985-1989 and 2016-2020, and
Population density map for species where the data are sufficient.
The website format will allow the user to zoom in on each map to see the details.
The Virginia Department of Wildlife Resources describes the importance of the geographic distribution maps:
“Comparing the two Atlases will shed light on changes in distribution for individual species over the past 30 years. Although programs such as the North American Breeding Bird Survey already tell us how bird populations have changed over time, maps produced through the Atlas will indicate where these population changes have unfolded on the landscape. By documenting where particular species are losing or gaining ground in the Commonwealth, we will be better positioned to identify where these species may benefit from conservation action.” https://dwr.virginia.gov/wildlife/birds/virginia-breeding-bird-atlas/.
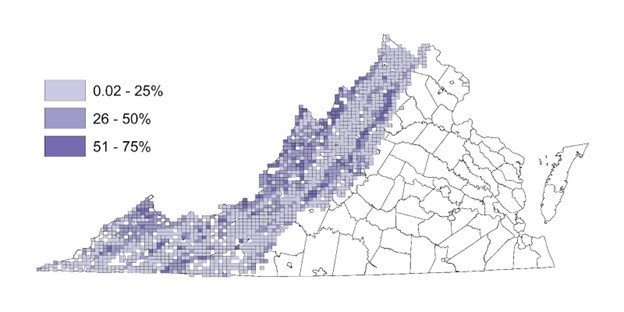
The maps below provide an example of breeding distribution maps – in this case for the Black-throated Blue Warbler (Setophaga caerulescens).

Map 1. Black-throated Blue Warbler, Breeding distribution based on probability of occurrence (First Atlas). This map indicates the probability that the BTBW will occur in an atlas block, based on the probability of detection (adjusted for variation in survey effort among blocks), as well as habitat and environmental factors.
Map 2. Black-throated Blue Warbler, Breeding distribution based on probability of occurrence (Second Atlas). This map indicates the probability that this species will occur in an atlas block, based on the probability of detection (adjusted for variation in survey effort among blocks), as well as habitat and environmental factors.

Map 3. Black-throated Blue Warbler, Change in breeding distribution between atlases based on probability of occurrence. NOTE: The gray blocks indicate no surveying was conducted.
Tables and Charts
Where sufficient data are available, the species accounts will include these tables, charts and related information:
Population trend chart,
Species associations with various types of habitats,
The species’ status in the Virginia Species of Greatest Conservation Concern, and
Breeding phenology information showing the typical dates for breeding, migration, and non-breeding seasons.
Photos
Each species account will include one or more high-quality photograph of the species. We expect to use photos taken by Virginia birders!
Species Account Narrative
The species account narrative will summarize and interpret the Atlas findings for the species by:
Presenting a brief introduction to the species
Interpreting the results shown in the maps, tables and charts:
breeding distribution
how the distribution has changed (or not) between the 1st and 2nd Atlases
population trends and abundance in the state
Virginia-specific information on the type of habitat associated with the species
Providing information on topics such as:
Number of eggs and/or broods, incubation time, and time to fledging
Breeding timing (phenology)
North American breeding range, if related to Virginia breeding distribution
Wintering or migration ranges, if related to Virginia population trends
Factors affecting population distribution, density or trend, where factors are known
The species account narrative will focus on and interpret Atlas results rather than be a general reference about the species. General references can readily be found in other sources, such as Cornell Laboratory of Ornithology’s All About Birds.
How you can help!
Donate to support the Atlas! Besides gaining the satisfaction of helping ensure the future of Virginia’s birds and environment, you will see your support recognized in the published Atlas.
1 North American Ornithological Atlas Committee Handbook: A Guide for Managers on the Planning and Implementation of a Breeding Bird Atlas Project. Bird Studies Canada, 2018, p. 114.

